
Nobel Price Winning Scientist Replicated Malling-Hansens Research and Confirmed his Results.
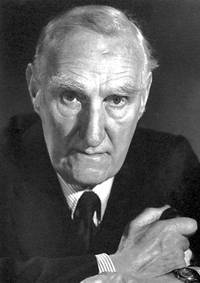
- John Boyd Orr, 1880-1971, Scottish teacher, doctor, biologist and politician who received the Nobel Peace Prize.
%EF%B9%94%22%3E%20%EF%BD%9C%20%3C%EA%A4%B7a%3E&md5=7b40b91efc621ba6a7a0b4087ef7b544.html)
Research, transcription and comments by Jørgen Malling Christensen.
The significance of Malling-Hansens physiological research into seasonal variations in childrens growth was evident after his ground-breaking presentation at the Medical Congress in Copenhagen in 1884 and after the publication (in German) of his extraordinary results. The echo of this impact continued to reverberate among scientists involved during the next two generations: paediatricians, physiologists and professionals involved in school hygiene and public health in general. Hence, a number of scientists all over the world replicated his methods and tested his results in the decades after 1884. Our Society has uncovered several of these scientists and reported on their results on this website. One of the most spectacular examples is that of Dr. John Boyd Orr, a highly respected scientist and Nobel Prize winner, who replicated RMH in the 1920s and reached similar results. He published a short article in the LANCET, summarising his research and giving due credit to Malling-Hansen. Incidentally, this was the same period as the Swedish scientist Gustav Nylin published his PhD thesis in 1929, entirely building on RMHs methods and results and confirming them. Below is a transcription of Dr Orrs article an excellent example of how RMH initiated a research tradition and inspired scientists the world over. My own assumption is that this line of research seasonal variations of human growth has continued ever since the 1880s and is still on-going today. It is our task, as Society members, to find, identify and publish such examples of research and hence to trace RMHs influence.
The LANCET, Aug 16, 1930: A REPORT ON SEASONAL VARIATION IN THE GROWTH OF SCHOOL-SCHILDREN
[1]By J.B. Orr[2], D.S.O., M.C., M.D., S.Sc. Glasg., Director of the Rowett Research Institute[3];
AND
M.L. Clark, L.L.A.
(From the Rowett Research Institute, Aberdeen.)
_________
During the investigation on the effect of milk on the growth of school-children, already reported in this journal[4] [5] there was evidence that the increase in height and weight of the children was not distributed evenly throughout the period of the test. To obtain further information on what appeared to be a seasonal variation in the rate of growth, the periodic measurements were continued for another year.
Previous Work.
To Malling-Hansen[6] we are indebted for the first accurately recorded observations on seasonal growth in height and weight, though Buffon[7] had suspected that summer and winter growth in height in children might not proceed at an equal rate. In the children of a deaf and dumb institution in Copenhagen, Malling-Hansen, from painstaking daily observations extending over three years, found three main periods of growth (excluding the summer vacation weeks). These were: --
PERIOD
| HEIGHT
| WEIGHT
|
Minimum
| Mid Sept to end Nov
| End April to mid July
|
Medium
| End Nov to end March
| Mid Dec to end April
|
Maximum
| End March to end June
| Mid Sept to mid Dec.
|
He also noted that the greatest weight increase was during and just immediately after the summer holiday, while there might even be loss of weight in the period from April to July. Camerer[8], on a few German children observed for several years, also noted seasonal differences in growth, with loss of weight in the warm spring days. Schmid-Monard [9] likewise found distinct periods in growth, the weight increase being greatest in the second half of the year, with an actual decrease occurring in March. Bleyer[10], in 1000 German infants, found the weight increase to slow down in winter and still more in spring and early summer, but to hasten in late summer and autumn. Porter,[11] in several thousand school-children in Boston, U.S.A., observed during their whole school life, was able to show a very marked seasonal difference in weight increase, the September to January period averaging (in boys) 3.40 lb., the February to June period 0.82 lb. He also found loss of weight in April, May, and June. Gebhardt,[12] with Italian children in New York, showed a spurt of weight in autumn and arrest (but not loss) in spring. Frank[13] found a seasonal difference in height increase even in infants from birth up to two years; a rapid rise from April to June, slowing down in the hot summer months and still more in the winter months. v. Wendt,[14] on 15,000 children in Finland aged from 11 to 16 years, found a maximum increase in height from June to September, in weight from October to January; a minimum in both height and weight from February to May. Emerson,[15] on the contrary, from records of over 800 children in such different centres as Honolulu, Toronto and New York, could find no difference in the rate of increase in height throughout the year, nor any correlation between the rate of increase in weight and the sunshine record in each city. He considers fluctuations in weight most probably due to infections and hygienic conditions, not to biologic reasons. Corry Mann [16] found that, in a group of 220 school boys, the increment in height during summer i.e., from April 1st to Oct. 1st was almost invariably greater than during the winter period from Oct. 1st to April 1st, and that there was also usually a greater gain in weight during the summer.
With the exception of these observations of Corry Mann, we have been unable to find any records of seasonal differences in growth of children in Scotland or England. The following observations, though on rather small numbers (657), are offered as a contribution to the existing data on this subject.
Present Investigation.
The children on whom the observations were made were attending public day schools in Glasgow, Edinburgh, Dundee, Peterhead, and Greenock.
METHOD.
The measurements were taken in the second and third weeks of December, 1928, March, June, September, and December, 1929. The children measured were from 7 to 11 years of age. They had received no supplementary feeding since June, 1928, and were therefore on their ordinary home diets.
All the measurements were taken by one observer, the centres visited in the same rotation, and children weighed and measured at the same time of day on each occasion, without shoes, but with indoor clothing. The average weight of clothing at each weighing was computed by the method described in the previous report[17], and the difference allowed for in calculating each increase in weight of the children. The weights were taken to the nearest eights of an inch. With these precautions it was hoped to ensure accurate records and to avoid the daily fluctuations in height and weight which previous observers (Malling-Hansen, Camerer, among others) had recorded, and which had been noted in the Scottish children in the milk tests (1), (2).
The periods were: (1) From December, 1928, to March, 1929. (2) From April, 1929, to June, 1929. (3) From July, 1929, to September, 1929. (4) From October, 1929, to December, 1929.
In the case of children who had suffered any serious illness the data were omitted from the records. The data for the Greenock children were also omitted, owing to the fact that the machine on which the weighings and measurings were done was changed after the first observations, and there was some doubt about the accuracy of the yardstick on the first machine which was not checked. The data were calculated separately, and though the results do not differ materially from those recorded from the other four centres, owing to the element of doubt as to their accuracy, it was necessary to omit them.
RESULTS.
The cards used were first of all divided into age-groups for each sex, irrespective of centre, and the mean increase in height and weight during each period were calculated. The results are given in Table I.
TABLE I. ---Height: Mean Increase in Inches.
Age in years
| Number
| Period
| |||
I. (Dec March)
| II. (April June)
| III. (July Sept)
| IV. (Oct Dec)
| ||
Boys
| |||||
7
| 59
| 0.4301
| 0.8518
| 0.5357
| 0.3773
|
8
| 40
| 0.4969
| 0.7535
| 0.5031
| 0.3081
|
9
| 26
| 0.4952
| 0.7396
| 0.4243
| 0.3542
|
10
| 111
| 0.4189
| 0.6848
| 0.4729
| 0.3114
|
11
| 70
| 0.3893
| 0.6848
| 0.4729
| 0.3114
|
Girls
| |||||
7
| 68
| 0.4926
| 0.7701
| 0.4909
| 0.3894
|
8
| 52
| 0.4809
| 0.7572
| 0.4828
| 0.3750
|
9
| 25
| 0.4700
| 0.7500
| 0.4375
| 0.3287
|
10
| 139
| 0.3858
| 0.7384
| 0.4991
| 0.3265
|
11
| 67
| 0.4123
| 0.7271
| 0.5438
| 0.3667
|
It will be seen that in every case the greatest increase in the year is in the second period (April, May, June) ; the smallest increase in the last period (October, November, December). In seven out of ten groups the third period (July, August, September) has the second greatest increase; also in seven out of ten groups the first period (January, February, March) has the second lowest increase.
Table II. gives the data for the boys of all ages combined and for girls of all ages combined.
TABLE II. Height: Mean Increases in Inches.
| Period
| |||
I. (Dec March)
| II. (April June)
| III. (July Sept)
| IV. (Oct Dec)
| |
Boys (all ages).
| ||||
Number
| 306
| 291
| 275
| 280
|
Av. increase
| 0.4298
| 0.7309
| 0.5063
| 0.3239
|
S.D.
| 0.2097
| 0.1960
| 0.1455
| 0.1644
|
Girls (all ages)
| ||||
Number
| 351
| 332
| 328
| 332
|
Av. increase
| 0.4318
| 0.7417
| 0.4959
| 0.3558
|
S.D.
| 0.2098
| 0.2237
| 0.1616
| 0.1478
|
As is seen from Table II., in both sexes the sequence in growth in height is the same; the increase is greatest in the second period, slackens considerably in the third, still more in the fourth, and begins to rise again in the first. When tested statistically, the difference between the increase at any two periods is significant, even in the case of the smallest difference i.e., between periods I. and II. The period of maximum growth is thus in agreement with that found by Malling-Hansen and Frank in countries with seasons approximately the same.
Table III. gives the data for weight increase separately for the different ages.
The increases in weight do not correspond from age to age so closely as the increases in height. In six groups out of ten the greatest weight increase is at weighing III. (After the summer holiday); in five groups the second greatest increase is made in period IV., the third greatest in period I., and in six groups the smallest in period II.
TABLE III. Weight: Mean Increase in Pounds.
Age in years
| Number
| Period
| |||
I. (Dec-March)
| II.(April-June)
| III.(July-Sept)
| IV.(Oct-Dec)
| ||
Boys
| |||||
7
| 59
| 1.2670
| 1.1342
| 1.3061
| 1.3046
|
8
| 40
| 1.6000
| 0.3750
| 1.4688
| 1.3546
|
9
| 26
| 0.8750
| 0.9688
| 1.5313
| 1.5937
|
10
| 111
| 1.7387
| 0.5764
| 1.8236
| 1.3835
|
11
| 70
| 1.3286
| 0.8043
| 2.0208
| 1.5682
|
Girls.
| |||||
7
| 68
| 0.8603
| 1.0936
| 1.7182
| 0.8360
|
8
| 52
| 0.9279
| 1.3413
| 1.2549
| 1.2600
|
9
| 25
| 0.5800
| 1.7174
| 1.6250
| 1.7500
|
10
| 139
| 1.0665
| 1.0213
| 1.9421
| 1.3358
|
11
| 67
| 1.3023
| 1.2083
| 2.2083
| 1.4084
|
Table IV. gives the data for the boys of all ages combined and for the girls of all ages combined.
In both sexes much the greatest increase in weight is made in the period that includes the summer holiday; the difference between this increase and that of any other period is statistically significant.
TABLE IV. Weight: Mean Increase in Pounds.
| Period
| |||
I. (Dec March)
| II. (April June)
| III. (July Sept)
| IV. (Oct Dec)
| |
Boys (all ages)
| ||||
Number
| 306
| 291
| 275
| 280
|
Av. increase
| 1.4677
| 0.7423
| 1.7070
| 1.3741
|
S.D.
| 1.2609
| 1.2463
| 1.2582
| 1.2551
|
Girls (all ages)
| ||||
Number
| 351
| 332
| 328
| 332
|
Av. increase
| 1.0149
| 1.1674
| 1.8268
| 1.2808
|
S.D.
| 1.3467
| 1.2199
| 1.2943
| 1.3230
|
The boys make in the first period an increase slightly, but not significantly, greater than in the fourth period; the girls in the fourth period an increase significantly greater than that of the first period but not than that of the second. The small increase made by the boys in the second period is remarkable. Questions at the June weighing brought out the fact that many children, and more particularly the boys, were practising for school sports.
The cards were scrutinised as to numbers showing no gain or definite loss of weight in the different periods with the following results: -
| Boys
| Girls
|
Period.
| Per cent.
| Per cent.
|
I. (Dec March)
| 12.4
| 22.7
|
II. (April June)
| 23.2
| 16.8
|
III. (July Sept)
| 6.5
| 4.7
|
IV. (Oct Dec)
| 12.5
| 16.5
|
HEIGHT AND WEIGHT COMPARED.
On comparing tables II. and IV. It is seen that the period of greatest increase in height is not that of the greatest increase in weight, nor that of least increase in height that of least increase in weight. Quite definitely the greatest weight increase is in the period following the greatest height increase, as is seen in the graph[18]. Dividing the increase into two periods, instead of into four there is a very decided difference, in both sexes, in both height and weight.
HEIGHT INCREASE (INCHES)
| ||
| Boys
| Girls
|
March-September
| 1.2372
| 1.2406
|
September March
| 0.7537
| 0.7876
|
WEIGHT INCREASE (IN POUNDS)
| ||
| Boys
| Girls
|
June-December
| 3.0811
| 3.1076
|
December-June
| 2.2100
| 2.1823
|
The increase in height from March to September is almost half an inch greater than that from September to March. The increase in weight is nearly one pound greater in the second half of the year than that in the first half. The periods of increase in height and weight are shown to be not coincident, but subsequent.
Summary.
Children to the number of 657, aged from 7 to 11 years, from four Scottish towns were measured and weighed in quarterly periods. They showed a very much greater increase in height in the three months from the end of March to the end of June than in any other period, and the smallest increase in height in the months of October, November, and December. The weight increase was greatest in the quarter July, August, September; second greatest in the quarter October, November, December. In the early summer quarter (April, May, June) about 25 per cent. of the boys actually lost weight although increasing in height.
Note. - Since this report was drawn up a paper has been published by Gustav Nylin,[19] giving observations on the growth of Swedish School-children. His results show a seasonal variation in growth, the maximum height increase being from March to May. They also show that maximum increase in height is associated with minimum increase in weight. The results are, therefore, in general agreement with those presented above.
[1] Part of the expenses of this Survey was defrayed by a grant made to the Department of Health for Scotland by the Empire Marketing Board. The Nutrition Committee of the Medical Research Council were kept informed of the progress of both this and the previous investigation on the effect of milk on school-children, and acknowledgement is made for the helpful advice and criticisms obtained from the committee, who are, however, not in any way responsible for the accuracy of the data or views expressed.
[2] JMC: The Lord Boyd-Orr, John Boyd Orr, 1880-1971, Scottish teacher, doctor, biologist and politician who received the Nobel Peace Prize for his scientific research into nutrition and his work in 1949 as the first Director-General of the United Nations Food and Agriculture Organization (FAO). He was also the co-founder and the first President (1960-1971) of the World Academy of Art and Science (WAAS).
Some of his many publications:
1) The National Food Supply and its Influence on Public Health (1934)
2) Food, Health and Income (1936)
3) Nutritional Science and State Planning (1937)
[3] JMC: The Rowett Research Institute is a research centre for studies into food and nutrition, located in Aberdeen, Scotland, founded in 1913. The first director was John Boyd Orr. On 1 July 2008 the Institute merged with the University of Aberdeen to become the Rowett Institute of Nutrition and Health, College of Life and Health, College of Life Sciences and Medicine. See also: Rowett Research Institute (http://www.rowett,ac.uk).
[4] Orr, J.B.: THE LANCET, 1928, i., 202
[5] Leighton, G., and Clark, M.L.: Ibid, 1929, i., 40
[6] Malling-Hansen, R.: Perioden in Gewicht der Kinder und in der Sonnenwärme, Kopenhagen, 1886.
[7] Buffon: Quoted in La Clinique Infantile, 1908, vi., 609.
[8] Camerer,W.: Jahrb. für Kinderh., 1893, xxxvi., 249
[9] Schmid-Monnard: (1895) quoted in Vierordts Anatomische, Physiologische, Physikalische Daten und Tabellen, Jena, 1906
[10] Bleyer: quoted by Frank (see...)
[11] Porter, W.T.: Amer. Jour. Phys., 1920, 1ii,. 121
[12] Gebhardt, J.C.: Publication 132 New York Assoc. to Improve the Condition of the Poor, New York, 1924.
[13] Frank, H.: Arch. für Kinderh., 1935, lxxv., 1.
[14] v. Wendt,G.: Klin.Woch., 1925, iv., 2389.
[15] Emerson,H.: Jour. Amer. Med. Assoc., 1927, lxxxix., 1326.
[16] Mann, H. Corry: Medical Research Council Special Report Series No. 105, 1926.
[17] Orr, J.B.: THE LANCET, 1928, i., 202.
[18] JMC: In my transcription, I could not include the graph; however, the graph in the original article is merely a graphic representation of the facts explained in the text and reported in the tables; hence, all the facts are still included in the transcription.
[19] Nylin, G.: Acta Med. Scand., 1929, Suppl. xxxi.